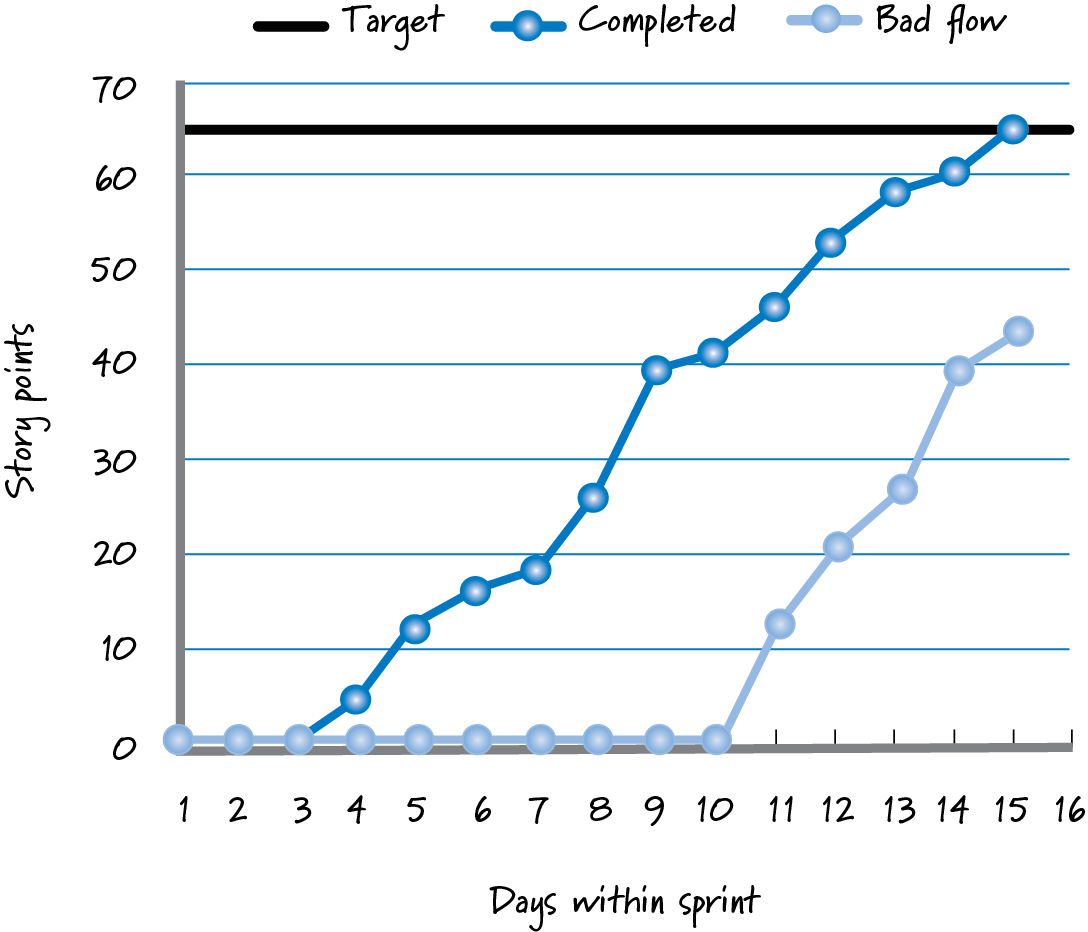
burnup chart
A graph that shows the progress of work toward a goal line associated with a value on the vertical axis. As work is completed over time (the horizontal axis), the progress line moves up (burns up) to be nearer to the goal line. We can show projected outcomes on burnup charts by calculating a trend line to see when work might be completed. Contrast with burndown chart.