This is the second article in our 10-article series: From Busy to Flowing – Unlocking Sustainable Agility. In the first article, we challenged the idea that keeping people busy leads to better results. Now, we turn to a fundamental question for any team or leader serious about improvement:
How do you know if your system is truly flowing—or just staying busy?
Improving flow efficiency means optimizing how work moves through your system, from idea to impact. But you can’t improve what you don’t measure. Let’s explore the flow metrics that matter most, so you can make data-informed decisions that lead to faster, smoother, and more predictable delivery.
Why Traditional Metrics Miss the Mark
Most organizations measure activity: tasks completed, hours logged, or individual utilization. These numbers may look good, but they rarely point out where value-delivery delays occur.
To understand and improve flow, you need metrics that shine a light on how value actually moves through your system. Not just how busy your people are, but how well your system delivers outcomes.
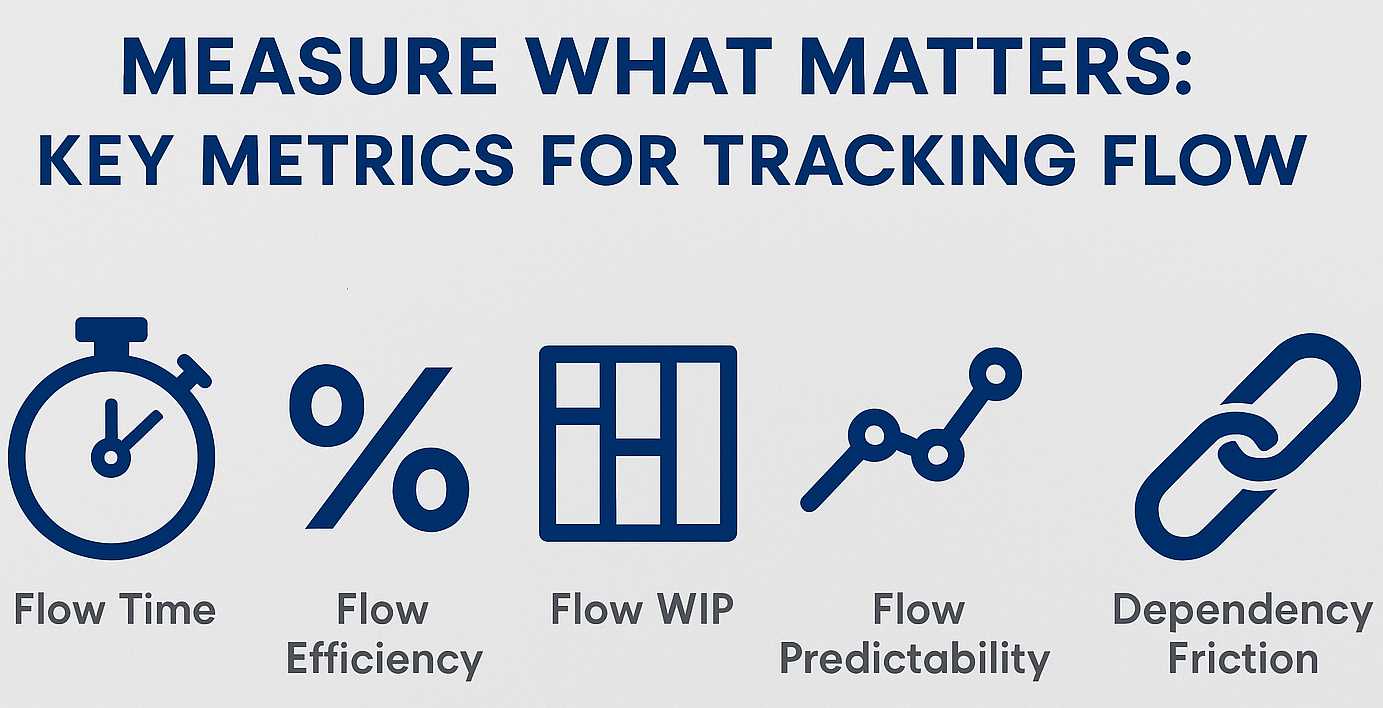
The Flow Metrics That Matter
Here are the five key metrics that will help you expose delays, spot improvement opportunities, and manage your delivery system more effectively.
1. Flow Time (a.k.a. Cycle Time)
What it is:
The total time a work item takes from the point of commitment to delivery—when a team agrees to start the work through to when it’s completed.
Why it matters:
Flow Time tells you how quickly your system delivers value once work has begun. It includes both active working time and waiting time (e.g., queues, blockers, and delays). You’ll often find that Flow Time is heavily influenced not by the work itself, but by shared dependencies that slow progress between teams and systems.
We’ll explore the systemic effects of shared dependencies and how they distort Flow Time in the next article.
Clarifying note:
Flow Time does not include the time a work item spends in a pre-commitment state, when it exists as an option under consideration (e.g., in a backlog, idea pool, or discovery stage). If understanding that option-state duration is important for your organization, you may wish to track it separately as Option Time or include it in Lead Time, which spans from idea to delivery.
Tracking both Flow Time and Option Time can give you a more holistic view of how ideas flow through your system—from proposal to completion.
2. Flow Efficiency %
What it is:
The percentage of Flow Time that a work item is actively being worked on versus waiting in queues, blocked, or idle.
Formula:
Active Time ÷ Flow Time × 100
Why it matters:
Most systems have low flow efficiency (e.g., 10% or less). This metric helps teams identify waste and reduce idle time. Dependencies—especially unmanaged or poorly coordinated ones—are a major source of hidden inefficiency.
3. Flow WIP (Work in Progress)
What it is:
The number of work items currently in progress—started but not yet completed.
Why it matters:
High WIP increases context switching, reduces focus, and slows down flow. It’s one of the biggest drivers of delays and unpredictability. Reducing WIP doesn’t increase team capacity—it improves how well existing capacity is utilized by minimizing waste, context switching, and delays—allowing teams to deliver more value with the same resources.
4. Flow Predictability
What it is:
The consistency and reliability of your Flow Time—how often you deliver work within expected timeframes.
Why it matters:
Stakeholders don’t just want fast delivery—they want delivery they can count on. Flow Predictability answers the question: Can we trust our delivery system?
- Consistency refers to how much variation exists in your Flow Time. A consistent system delivers work items in a narrow, predictable range (e.g., most stories complete in 6–8 days).
- Reliability refers to how often you meet your forecasted or promised delivery timeframe. Even if your Flow Time varies, you can still be reliable if your forecasts consistently account for that variation.
The most effective teams are both consistent and reliable: they understand their delivery patterns and communicate realistic expectations—building trust across the organization.
Inconsistent Flow Time is often caused by inconsistent coordination with shared dependencies—something we’ll explore in depth in the next article.
5. Dependency Friction (Preview of the Next Article in the Series)
What it is:
A systemic source of drag in modern delivery systems. Dependency Friction reflects the organizational tax created by the effort, waiting, coordination, and risk associated with managing shared dependencies—the handoffs, approvals, or team-to-team dependencies that span organizational boundaries.
Why it matters:
Even when teams perform well individually, work often gets stuck waiting on others. Shared dependencies increase unpredictability, coordination overhead, and rework. And unlike local blockers, this type of friction is systemic—invisible in traditional tooling but deeply embedded in how the organization is structured.
In our next article, we’ll show you how to quantify Dependency Friction using a set of system-level metrics—and why it may be the biggest hidden cost in your value stream.
Making Flow Metrics Actionable
To get the most value from these metrics:
- Visualize your work: Make queues, wait states, and WIP visible on boards and dashboards.
- Track trends: Use flow data to guide continuous improvement, not micromanagement.
- Act on insights: Limit WIP, eliminate blockers, and streamline handoffs.
- Use metrics for learning, not blaming: Flow metrics are about system health, not individual performance.
Flow Metrics Drive Better Business Outcomes
When you measure flow—not just effort—you enable:
- Faster delivery
- More reliable planning
- Less waste and rework
- More engaged teams
- Happier customers
Flow isn’t about going faster. It’s about going smoother—with less friction, more clarity, and better results.
Flow isn’t just a technical metric—it’s a competitive advantage!
Up Next in the Series:
The Hidden Drag on Flow: Measuring and Reducing Dependency Friction
We’ll explore how to define and quantify Dependency Friction, understand how shared dependencies distort flow metrics, and introduce a set of building blocks you can use to create your own Dependency Friction score.
Ready to Start Tracking What Really Matters?
If your teams are tracking tasks but not flow, you may be missing the signals that reveal where your system is truly stuck.
Whether you’re new to flow metrics or ready to refine your measurement approach, I can help you identify the right signals, visualize your delivery system, and start making sustainable improvements.
Let’s talk about how to measure what matters—so your work can flow.
Contact us to learn more about private training or schedule a consultation.